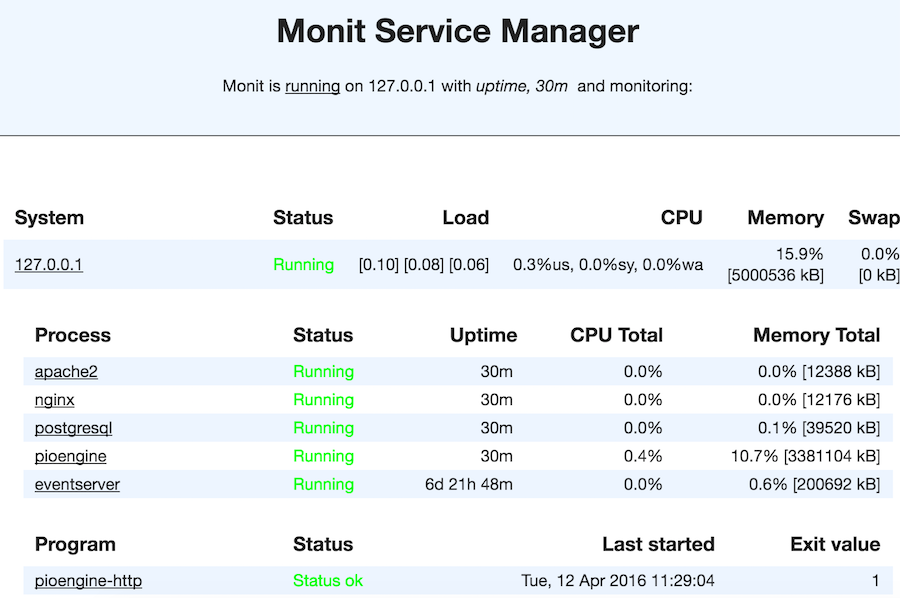
If you're using PredictionIO in a production setting, you'll want some way to make sure it is always up. Monit is a tool which will monitor important processes and programs. This guide will show how to set up monit on your PredictionIO server to keep an engine always up and running.
You can install monit on ubuntu with
1 | sudo apt-get install monit |
Configure Basics
Now we can configure monit by the configuration file /etc/monit/monitrc with your favorite editor. You will notice that this file contains quite a bit already, most of which is commented instructions/examples.
First, choose the interval on which you want monit to check the status of your system. Use the set daemon command for this, it should already exist in the configuration file.
1 | set daemon 60 #checks at 1-minute intervals |
The check system block should also already be present, under the services block.
1 2 3 4 5 6 7 8 | check system 127.0.0.1
if memory usage > 75% then alert
if swap usage > 25% then alert
if loadavg (1min) > 4 then alert
if loadavg (5min) > 2 then alert
if cpu usage (user) > 70% then alert
if cpu usage (system) > 30% then alert
if cpu usage (wait) > 20% then alert
|
You might also want to configure the built in web server.
1 2 | set httpd port 2812 allow admin:yourpassword # require user 'admin' with password 'yourpassword' |
More examples on configuring the web server are included in the default config file.
Configuration blocks for common services like apache, nginx, or PostgreSQL can be found here
Configure for PredictionIO
Event Server
Now the interesting stuff, lets add monitoring for the event server.
1 2 3 4 5 | check process eventserver
matching "Console eventserver"
start program = "/etc/monit/modebug /home/ubuntu/event_scripts.sh start"
stop program = "/etc/monit/modebug /home/ubuntu/event_scripts.sh stop"
if cpu usage > 95% for 10 cycles then restart
|
This block references a script, event_scripts.sh. This script tell monit how to restart the engine and event server if they go down.
The script might differ slightly depending on your environment but it should look something like what is shown below. Assume SimilarProduct is the your pio app directory.
1 2 3 4 5 6 7 8 9 10 11 12 13 | #!/bin/bash case $1 in start) cd /home/ubuntu/SimilarProduct/ nohup /opt/PredictionIO/bin/pio eventserver > /home/ubuntu/events.log & ;; stop) event_pid=`pgrep -f "Console eventserver"` kill "$event_pid" ;; *) esac exit 0 |
Note that this is dumping output to an events log at /home/ubuntu/events.log. Also, be sure that this file is executable with sudo chmod +x event_scripts.sh
Engine
The first step here is similar to checking the engine process.
1 2 3 4 5 | check process pioengine
matching "Console deploy"
start program = "/etc/monit/modebug /home/ubuntu/engine_scripts.sh start"
stop program = "/etc/monit/modebug /home/ubuntu/engine_scripts.sh stop"
if cpu usage > 95% for 10 cycles then restart
|
Be sure to adjust your deploy command to your environment (driver-memry, postgres jar path)
1 2 3 4 5 6 7 8 9 10 11 12 13 | #!/bin/bash case $1 in start) cd /home/ubuntu/SimilarProduct/ nohup /opt/PredictionIO/bin/pio deploy -- --driver-class-path /home/ubuntu/postgresql-9.4.1208.jre6.jar --driver-memory 16G > /home/ubuntu/deploy.log & ;; stop) deploy_pid=`pgrep -f "Console deploy"` kill "$deploy_pid" ;; *) esac exit 0 |
There can be cases when the process is running but the engine is down however. If the Akka HTTP REST API used by PredictionIO crashes, the engine process continues but the engine to fail when queried.
This sort of crash can be taken care of by using monits check program capability.
1 2 3 4 5 | check program pioengine-http with path "/etc/monit/bin/check_engine.sh" start program = "/etc/monit/modebug /home/ubuntu/engine_scripts.sh start" stop program = "/etc/monit/modebug /home/ubuntu/engine_scripts.sh stop" if status != 1 then restart |
This block executes the script at /etc/monit/bin/check_engine.sh and reads the exit status. Depending on the exit status, the block can run a restart script. The restart script can be the same as what is used in the process monitor, but we need a check_engine script.
1 2 3 4 5 6 7 8 9 10 11 12 | #!/bin/bash # source: /etc/monit/bin/check_engine.sh url="http://127.0.0.1:8000/queries.json" check_string="itemScores" response=$(curl -H "Content-Type: application/json" -d '{ "user": "1", "num": 0}' $url) if [[ "$response" =~ "$check_string" ]] then exit 1 else exit 0 fi |
This script does a curl request and checks the response. In this example, a user known to exist is used and then check make sure the json returned has "itemScores". This can vary between use cases but the idea should be similar.
Again, make sure this file is executable.
Start it All Up
Now we can get monit running with
1 | sudo service monit restart |
Navigate to http://<your ip>:2812/ to check out your status page

Testing
To test, try killing your deployed engine or event server and see if monit brings it back up. You can even use the scripts we described above to do this
1 | sudo ./engine_scripts.sh stop |
Remember that monit checks only as often as you tell it to, so it may need a few minutes.
