Apache Zeppelin is an interactive computational environment built on Apache Spark like the IPython Notebook. With Apache PredictionIO and Spark SQL, you can easily analyze your collected events when you are developing or tuning your engine.
Prerequisites
The following instructions assume that you have the command sbt accessible in your shell's search path. Alternatively, you can use the sbt command that comes with Apache PredictionIO at $PIO_HOME/sbt/sbt.
Export Events to Apache Parquet
PredictionIO supports exporting your events to Apache Parquet, a columnar storage format that allows you to query quickly.
Let's export the data we imported in Recommendation Engine Template Quick Start, and assume the App ID is 1.
1 | $ $PIO_HOME/bin/pio export --appid 1 --output /tmp/movies --format parquet |
After the command has finished successfully, you should see something similar to the following.
1 2 3 4 5 6 7 8 9 10 11 | root |-- creationTime: string (nullable = true) |-- entityId: string (nullable = true) |-- entityType: string (nullable = true) |-- event: string (nullable = true) |-- eventId: string (nullable = true) |-- eventTime: string (nullable = true) |-- properties: struct (nullable = true) | |-- rating: double (nullable = true) |-- targetEntityId: string (nullable = true) |-- targetEntityType: string (nullable = true) |
Building Zeppelin for Apache Spark 1.2+
Start by cloning Zeppelin.
1 | $ git clone https://github.com/apache/zeppelin.git
|
Build Zeppelin with Hadoop 2.4 and Spark 1.2 profiles.
1 2 | $ cd zeppelin $ mvn clean package -Pspark-1.2 -Dhadoop.version=2.4.0 -Phadoop-2.4 -DskipTests |
Now you should have working Zeppelin binaries.
Preparing Zeppelin
First, start Zeppelin.
1 | $ bin/zeppelin-daemon.sh start
|
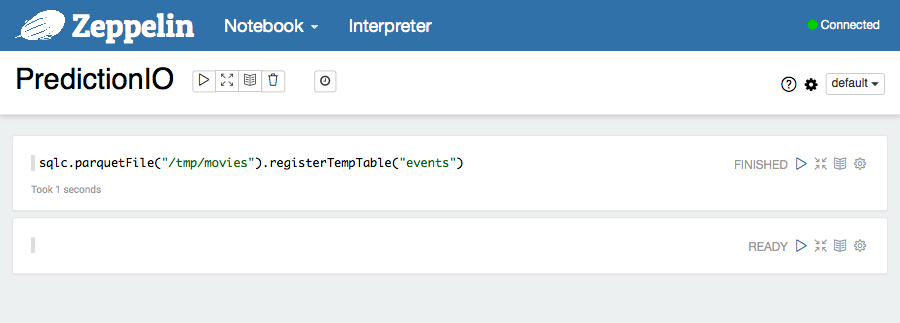
By default, you should be able to access Zeppelin via web browser at http://localhost:8080. Create a new notebook and put the following in the first cell.
1 | sqlc.parquetFile("/tmp/movies").registerTempTable("events") |

Performing Analysis with Zeppelin
If all steps above ran successfully, you should have a ready-to-use analytics environment by now. Let's try a few examples to see if everything is functional.
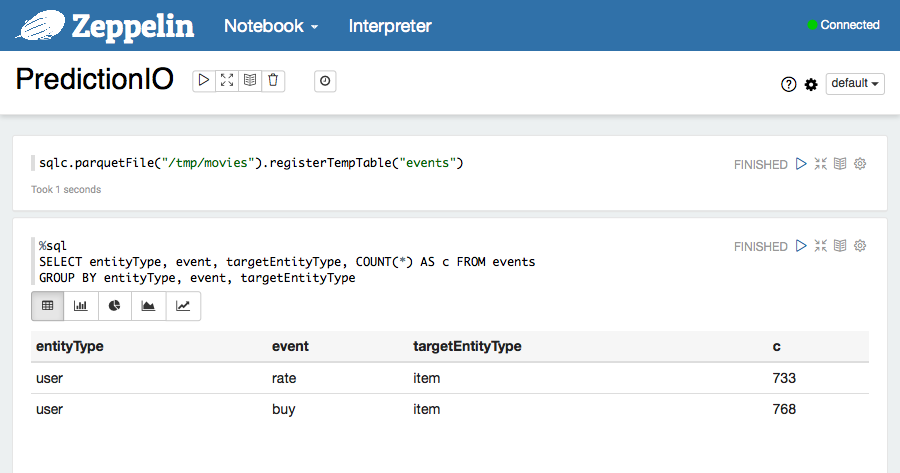
In the second cell, put in this piece of code and run it.
1 2 3 | %sql SELECT entityType, event, targetEntityType, COUNT(*) AS c FROM events GROUP BY entityType, event, targetEntityType |

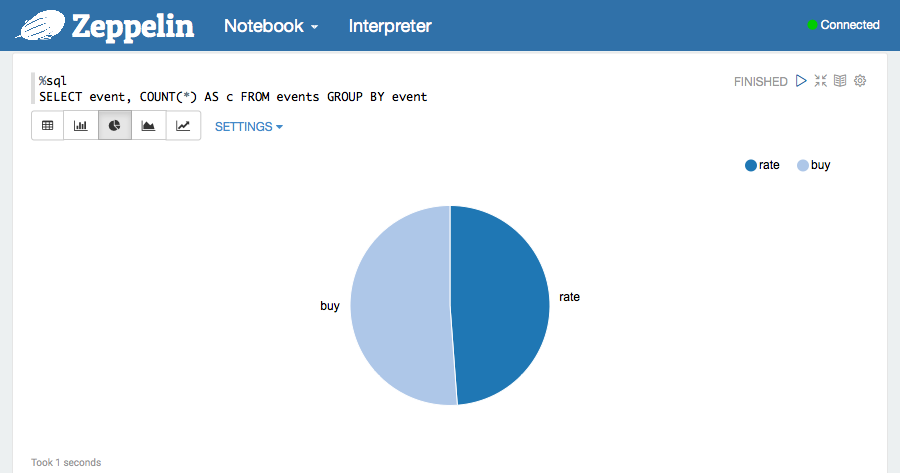
We can also easily plot a pie chart.
1 2 | %sql SELECT event, COUNT(*) AS c FROM events GROUP BY event |

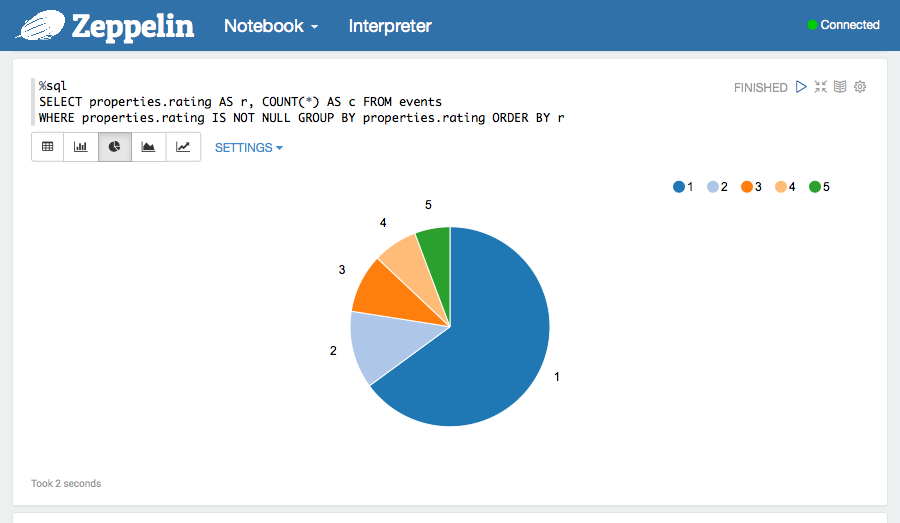
And see a breakdown of rating values.
1 2 3 | %sql SELECT properties.rating AS r, COUNT(*) AS c FROM events WHERE properties.rating IS NOT NULL GROUP BY properties.rating ORDER BY r |

Happy analyzing!
